K Means
Introduction
K-means clustering is one of the simplest and popular unsupervised machine learning algorithms.
A cluster refers to a collection of data points aggregated together because of certain similarities.
You’ll define a target number k, which refers to the number of centroids you need in the dataset. A centroid is the imaginary or real location representing the center of the cluster.
Every data point is allocated to each of the clusters through reducing the in-cluster sum of squares.
The ‘means’ in the K-means refers to averaging of the data; that is, finding the centroid.
There is an algorithm that tries to minimize the distance of the points in a cluster with their centroid – the k-means clustering technique.
The main objective of the K-Means algorithm is to minimize the sum of distances between the points and their respective cluster centroid.
Steps
Let’s now take an example to understand how K-Means actually works:
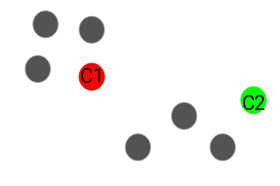
 We have these 8 points and we want to apply k-means to create clusters for these points. Here’s how we can do it.
Step 1: Choose the number of clusters k
The first step in k-means is to pick the number of clusters, k.
Step 2: Select k random points from the data as centroids
Next, we randomly select the centroid for each cluster. Let’s say we want to have 2 clusters, so k is equal to 2 here. We then randomly select the centroid:
Step 3: Assign all the points to the closest cluster centroid
Once we have initialized the centroids, we assign each point to the closest cluster centroid:
Here you can see that the points which are closer to the red point are assigned to the red cluster whereas the points which are closer to the green point are assigned to the green cluster.
Step 4: Recompute the centroids of newly formed clusters
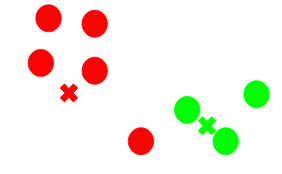
Now, once we have assigned all of the points to either cluster, the next step is to compute the centroids of newly formed clusters:
Here, the red and green crosses are the new centroids.
Step 5: Repeat steps 3 and 4
We then repeat steps 3 and 4:
The step of computing the centroid and assigning all the points to the cluster based on their distance from the centroid is a single iteration. But wait – when should we stop this process? It can’t run till eternity, right?
Here, the red and green circles represent the centroid for these clusters.
K-Means is really just the EM (Expectation Maximization) algorithm applied to a particular naive bayes model.
There are essentially three stopping criteria that can be adopted to stop the K-means algorithm:
Centroids of newly formed clusters do not change
Points remain in the same cluster
Maximum number of iterations are reached
Applications of Clustering in Real-World Scenarios
Clustering is a widely used technique in the industry. It is actually being used in almost every domain, ranging from banking to recommendation engines, document clustering to image segmentation.
Customer Segmentation
We covered this earlier – one of the most common applications of clustering is customer segmentation. And it isn’t just limited to banking. This strategy is across functions, including telecom, e-commerce, sports, advertising, sales, etc.
Document Clustering
This is another common application of clustering. Let’s say you have multiple documents and you need to cluster similar documents together. Clustering helps us group these documents such that similar documents are in the same clusters.
We can also use clustering to perform image segmentation. Here, we try to club similar pixels in the image together. We can apply clustering to create clusters having similar pixels in the same group.
You can refer to this article to see how we can make use of clustering for image segmentation tasks.
Recommendation Engines
Clustering can also be used in recommendation engines. Let’s say you want to recommend songs to your friends. You can look at the songs liked by that person and then use clustering to find similar songs and finally recommend the most similar songs.
There are many more applications which I’m sure you have already thought of. You can share these applications in the comments section below. Next, let’s look at how we can evaluate our clusters.
Understanding the Different Evaluation Metrics for Clustering
Inertia
Inertia actually calculates the sum of distances of all the points within a cluster from the centroid of that cluster.

We calculate this for all the clusters and the final inertial value is the sum of all these distances. This distance within the clusters is known as intracluster distance. So, inertia gives us the sum of intracluster distances
The distance between them should be as low as possible.
Dunn Index
Along with the distance between the centroid and points, the Dunn index also takes into account the distance between two clusters. This distance between the centroids of two different clusters is known as inter-cluster distance. Let’s look at the formula of the Dunn index:

Dunn index is the ratio of the minimum of inter-cluster distances and maximum of intracluster distances.
We want to maximize the Dunn index. The more the value of the Dunn index, the better will be the clusters. Let’s understand the intuition behind Dunn index:
In order to maximize the value of the Dunn index, the numerator should be maximum. Here, we are taking the minimum of the inter-cluster distances. So, the distance between even the closest clusters should be more which will eventually make sure that the clusters are far away from each other.


Also, the denominator should be minimum to maximize the Dunn index. Here, we are taking the maximum of intracluster distances. Again, the intuition is the same here. The maximum distance between the cluster centroids and the points should be minimum which will eventually make sure that the clusters are compact.
How to Choose the Right Number of Clusters in K-Means Clustering?
The maximum possible number of clusters will be equal to the number of observations in the dataset.
One thing we can do is plot a graph, also known as an elbow curve, where the x-axis will represent the number of clusters and the y-axis will be an evaluation metric.

The cluster value where this decrease in inertia value becomes constant can be chosen as the right cluster value for our data.
Last updated


